Analytics
Workload
The workload report includes the overview, trend of conversations and messages, conversation distribution (by conversation labels), conversation distribution (by messages), conversation distribution (by duration), agent workload, and team workload. You can filter these data and export the report based on the filtering options (including the time period, conversation tag, channel, channel account, agent, team, and conversation type). All query results are displayed in real time.
Metrics in the overview and graphics are system metrics; those in agent/team workload tables are for each agent/team.
To view the workload report, go to “Admin Mode > Analytics > Workload”. By default, the Workload page displays the workload completed by all agents this week.
Overview
The workload overview includes the system metrics: the number of messages, the number of end sessions, the number of subsequent sessions, the average number of single-session messages, the maximum number of single-session messages, the duration of the session, and the maximum duration of the session.
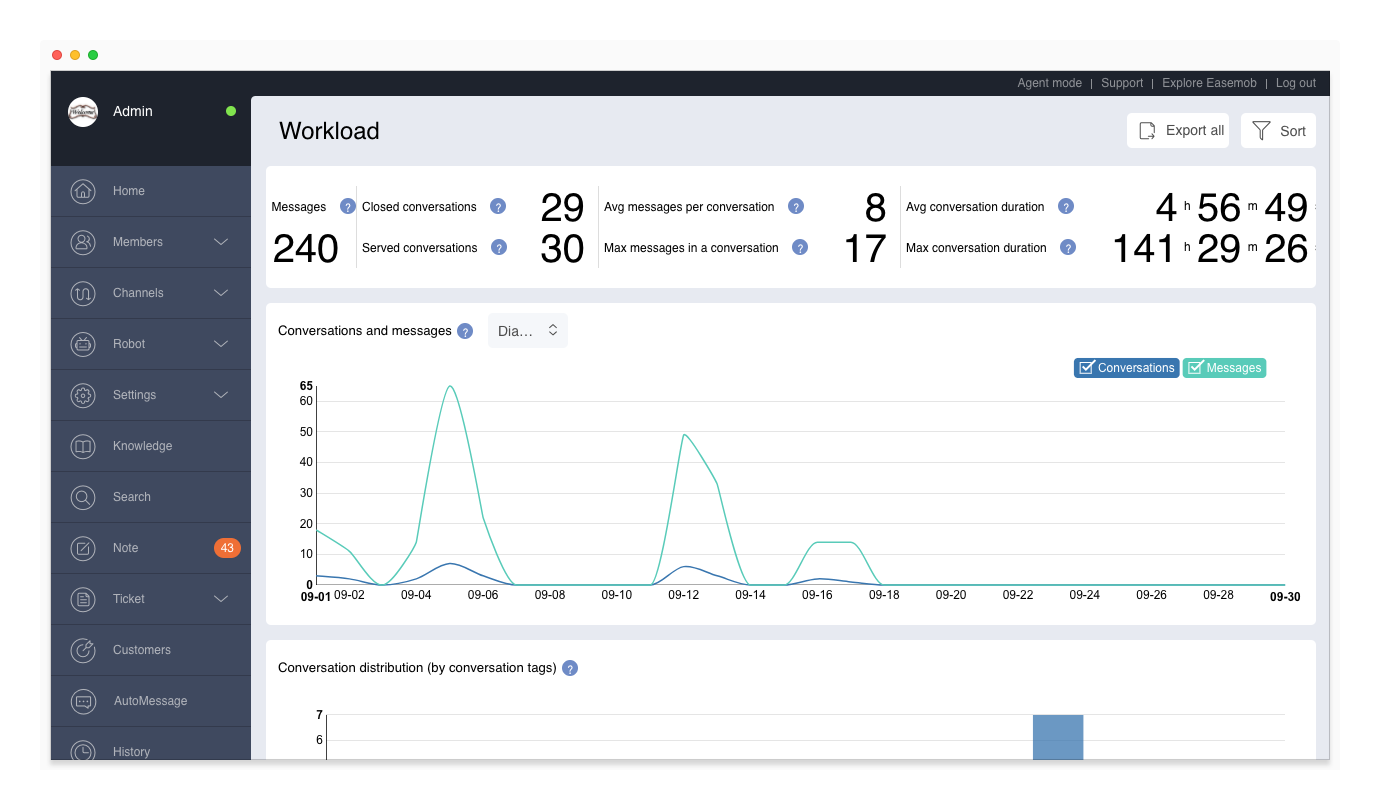
Note: In the above figure, the conversation duration is measured by hours/minutes/seconds. The maximum value is 99999 hours 59 minutes 59 seconds. In agent/team workload tables and workload reports, the conversation duration is measured by seconds, and the actual value is displayed.
The workload metrics are described as follows:
- Messages: Number of messages sent by the customer, agent, and system in closed conversations with customers. Messages sent between colleagues and in notes are not included.
- Closed conversations: Number of conversations that are closed, including incoming and callback conversations served by all agents. If a conversation has been transferred between agents, the conversation is counted as one conversation in the system.
- Served conversations: Number of incoming and callback conversations served by all agents, including closed and ongoing conversations. If a conversation has been transferred between agents, the conversation is counted as one conversation in the system.
- Avg messages per conversation: Average number of messages in each closed conversation.
- Maximum messages in a conversation:Number of messages in the conversation that has the largest number of messages among all closed conversations.
- Average conversation duration: Average conversation duration = Total conversation durations / Number of closed conversations. (Duration of a conversation = End time - Start time)
- Maximum conversation duration: Duration of the conversation that lasted the longest among all closed conversations. (Duration of a conversation = End time - Start time)
Note: Queued conversations, if directly closed without being served, are not counted as “served conversations” or “closed conversations”.
Use the following figure as an example. After being created, the conversation is served by agent A and then transferred to agent B. In the following figure, after a conversation is created, after the creation of the session, the first customer service A access, and then transferred to the customer service B, the session of the indicators:
- Conversation duration: For the system, the duration is the period between the start time and end time of the conversation. For agent A, the duration is the period between the start time and the transfer time. For agent B, the duration is the period between the transfer time and the end time.
- Messages: For the system, the messages include those sent by the customer, agents and system during the whole conversation (between start time and end time). For agent A, the messages include those sent by the customer, agent A and the system before the conversation is transferred. For agent B, the messages include those sent by the customer, agent B and the system after the conversation is transferred.
If a conversation is transferred between different teams, the conversation duration and messages are divided between the teams in the same way as between agents.
Conversations and Messages
Display the distribution of conversations started every day and the messages in these conversations in a diagram or histogram. The number of conversations is consistent with the History page.
Conversation Distribution (by Conversation Tags)
Display the distribution of conversations based on the conversation tags. When filtering the workload data:
- If you select All Tags, the number of conversations corresponding to each root node of the conversation tags is displayed (the number of conversations of a root node contains the total number of conversations under all its leaf nodes).
- If you select Specified Tags, you can select any conversation tags. The number of conversations corresponding to the selected tags will be displayed (if you select a root node or branch node, the number of conversations contains the total number of conversations under all its leaf nodes).
- If you select No Tags, no data is displayed.
Conversation Distribution (by Messages)
Display the distribution of conversations based on the number of messages.
Conversation Distribution (by Duration)
Display the distribution of conversations based on the conversation durations.
Agent Workload
On the Workload page, you can directly view the workload of each agent. The metrics are described as follows:
- Joined/in: Method in which the agent serves the conversation. The number of conversations the agent joined and the number of conversations transferred (in) to the agent.
- Out/closed: Method in which the agent finishes the conversation. The number of conversations the agent transferred (out) to others and the number of conversations the agent closed.
- Agent/customer/system: Number of agent, customer, system messages sent during the period the agent served the conversations.
- Duration: Period in which the agent served the conversations. For each conversation, the period can either be:
- Length of time between the start time and end time of the conversation (no transfer)
- Length of time between the start time and transfer out time (transfer involved)
- Length of time between the transfer in time and transfer out time (transfer involved)
- Length of time between the transfer in time and end time (transfer involved)
- Messages: Number of messages sent by the agent, customer and system during the period the agent served the conversations.
Team Workload
To view the workload of each team, click Sort on the Workload page and select Team. The metrics for teams are similar to those for agents. For example:
- Joined/in: Method in which the team serves the conversation. The number of conversations the team joined and the number of conversations transferred (in) to the team.
- Out/closed: Method in which the team finishes the conversation. The number of conversations the team transferred (out) to others and the number of conversations the team closed.
Note: If a conversation is transferred (in & out) within a team, the conversation is counted as one conversation for the team.
Filter Workload Data
To filter workload data, click Sort on the Workload page and select the channel, channel account, agent, and team. Multiple agents and teams can be selected at the same time, and fuzzy query is supported for searching for the agents.
Note:
- The time period contains the start time and end time of closed conversations, or the start time of served conversations.
- When workload data is filtered based on the agent or team name, only data in the agent or team workload table is filtered.
Export the Workload Report
On the Workload page, click Export All to export a workload report in a CSV file. The CSV file can be used for data accumulation and analysis.
Service Quality
The service quality report includes the overview, satisfaction ratings, review ratings, valid conversations, conversation distribution (by first response time), conversation distribution (by average response time), agent service quality, and team service quality. You can filter these data and export the report based on the filtering options (including the time period, conversation tag, channel, channel account, agent, and team). All query results are displayed in real time.
Metrics in the overview and graphics are system metrics; those in agent/team service quality tables are for each agent/team.
To view the service quality report, go to “Admin Mode > Analytics > Service Quality”. By default, the Service Quality page displays the service quality of all agents this week.
Overview
The Service Quality overview includes the system metrics: satisfaction ratings, average first response time, maximum first response time, average response time, and maximum response time.
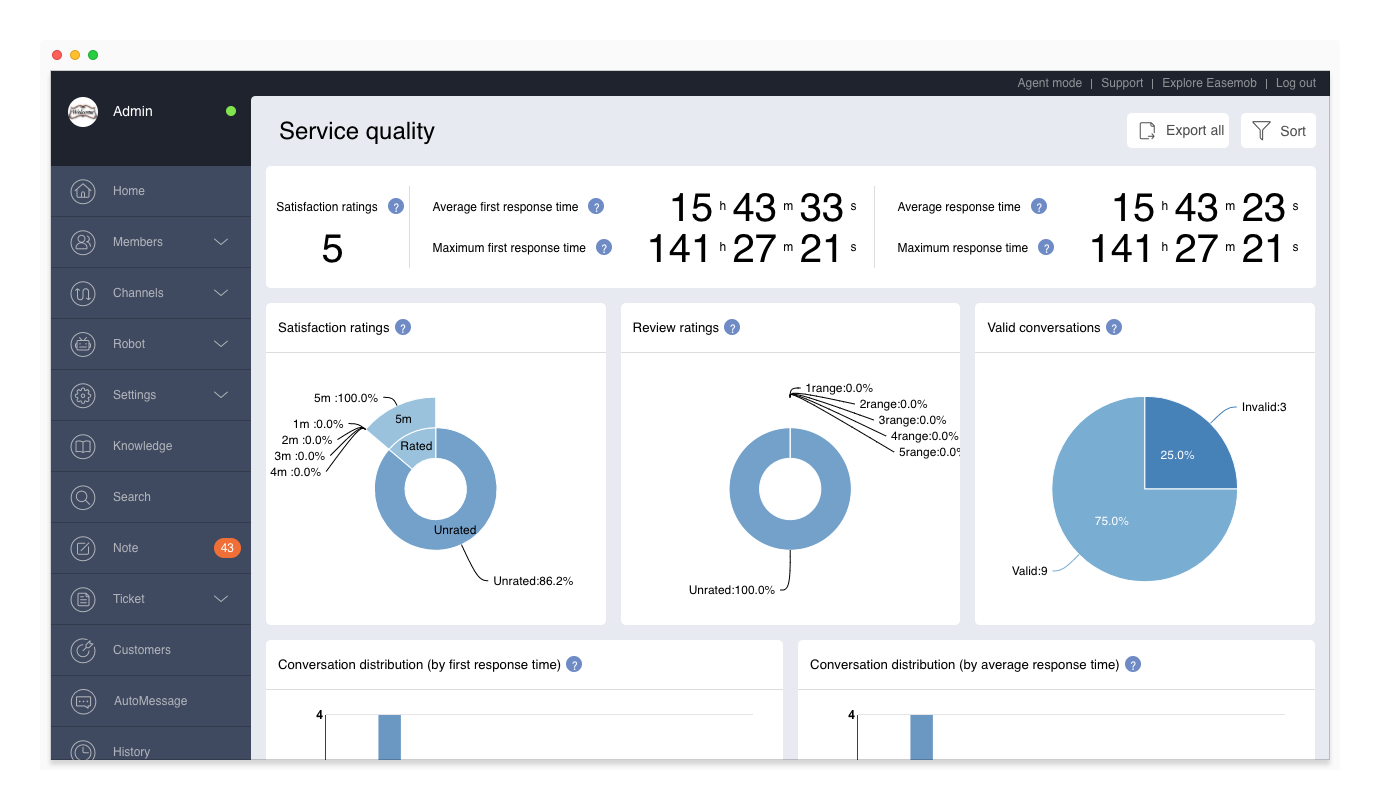
Note: In the above figure, the first response time and response time is measured by hours/minutes/seconds. The maximum value is 99999 hours 59 minutes 59 seconds. In agent/team service quality tables and service quality reports, the average response time and response time are measured by seconds, and the actual value is displayed.
The service quality metrics are described as follows:
- Satisfaction ratings: Average of the satisfaction ratings to the conversations that the agent served. If no conversations are rated, 0 is displayed.
- Average first response time: Average of the first response time of all closed conversations (first response time of a conversation = time of the agent's first message - start time of the conversation).
- Maximum first response time: Maximum first response time among all closed conversations (first response time of a conversation = time of the agent's first message - start time of the conversation).
- Average response time: Average of the average response time of all closed conversations (as shown below).
- Maximum response time: Maximum of the average response time among all closed conversations (as shown below).
Use the following figure as an example. After being created, the conversation is served by agent A and then transferred to agent B. The metrics for the conversation are described as follows:
- First response time: For the system, the first response time is the period between the start time of the conversation and the time of the agent's first message (in this case, agent A's first message). For agent A, the first response time is the period between the start time of the conversation and the time of agent A's first message. For agent B, the first response time is the period between the transfer in time and the time of agent B's first message.
- Average response time: For the system, the average response time is the average of the response time of all agents. For agent A, the average response time is the average of the response time of agent A. For agent B, the average response time is the average of the response time of agent B.
If a conversation is transferred between different teams, the first and average response times are divided between the teams in the same way as between agents.
Satisfaction Ratings
Display the distribution of satisfaction ratings in closed conversations.
- Unrated: Percentage of unrated conversations among all closed conversations.
- 1, 2, 3, 4, 5: Percentage of conversations that are rated 1 star, 2 stars, 3 stars, 4 stars, and 5 stars among all closed conversations.
Review Ratings
Display the distribution of review ratings in closed conversations. * Unrated: Percentage of unrated conversations among all closed conversations. * 1, 2, 3, 4, 5: Percentage of conversations that are rated the scores 1, 2, 3, 4, and 5 among all closed conversations.
Valid Conversations
Display the percentage of valid conversations among all closed conversations.
- Valid conversations: A valid conversation contains at least one customer message and one agent message.
- Invalid conversations: An invalid conversation does not contain any customer message or any agent message.
Note:
- Inbound conversations: An inbound conversation contains at least one customer message. If it also contains an agent message, the conversation is valid.
- Callback conversations: A callback conversation usually contains at least one agent message. If it also contains a customer message, the conversation is valid.
- Transferred conversations: If a conversation is served by agent A and transferred to agent B and neither agent sends any message during the conversation, the conversation is invalid. The conversation is counted as an invalid conversation for the system, for agent A, and for agent B.
Conversation Distribution (by First Response Time)
Display the distribution of conversations based on the first response time. First response time of a conversation = Time of the agent's first message - Start time of the conversation.
Conversation Distribution (by Average Response Time)
Display the distribution of conversations based on the average response time. Average response time of a conversation = Total response time of the conversation/Number of times.
Agent Service Quality
On the Service Quality page, you can directly view the service quality of each agent. The metrics are described as follows:
- First response time: Period between the time a conversation is served (joined or transferred in), and the time of the agent's first message.
- Average response time: Average of all response times of the agent.
- Satisfaction (involvement): Average of satisfaction ratings of the agent's rated conversations and percentage of rated conversations.
- Satisfaction (involvement): Average of review ratings of the agent's rated conversations and percentage of rated conversations.
Note: the valid/invalid conversations and first/average response time are not calculated for the robot. But the robot shares the satisfaction ratings with the agent that serves the same conversation.
Team Service Quality
To view the service quality of each team, click Sort on the Service Quality page and select Team.
The metrics for teams are similar to those for agents. For example:
- First response time: Period between the time a conversation is served (joined or transferred in), and the time of the team's first message.
- Average response time: Average of all response times of the team.
Note: If a conversation is transferred (in & out) within a team, the first response time of the team is the average of the first response times.
Filter Service Quality Data
To filter service quality data, click Sort on the Service Quality page and select the channel, channel account, agent, and team. Multiple agents and teams can be selected at the same time, and fuzzy query is supported for searching for the agents.
Note:
- The time period contains the start time and end time of closed conversations.
- When service quality data is filtered based on the agent or team name, only data in the agent or team service quality table is filtered.
Export the Service Quality Report
On the Service Quality page, click Export All to export a service quality report in a CSV file. The CSV file can be used for data accumulation and analysis.
Agent Worktime
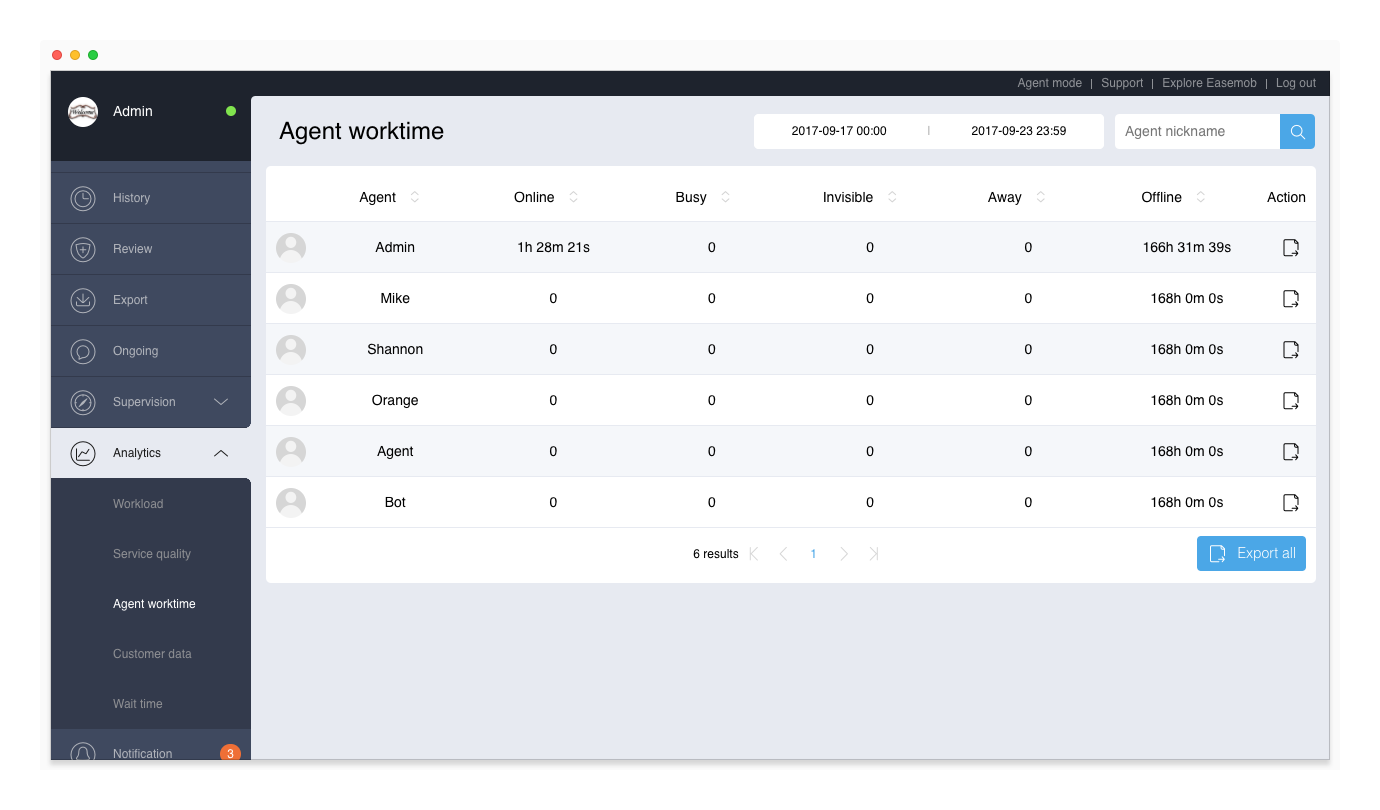
On the Agent Worktime page, you can view the agents' online and offline durations, filter the data based on the date and time and agent name, and export the agent worktime report. The sum of the online and offline duration is equal to the length of the selected time period.
To view the login detail of an agent, including the login IP address, just click on the agent.
Customer Data
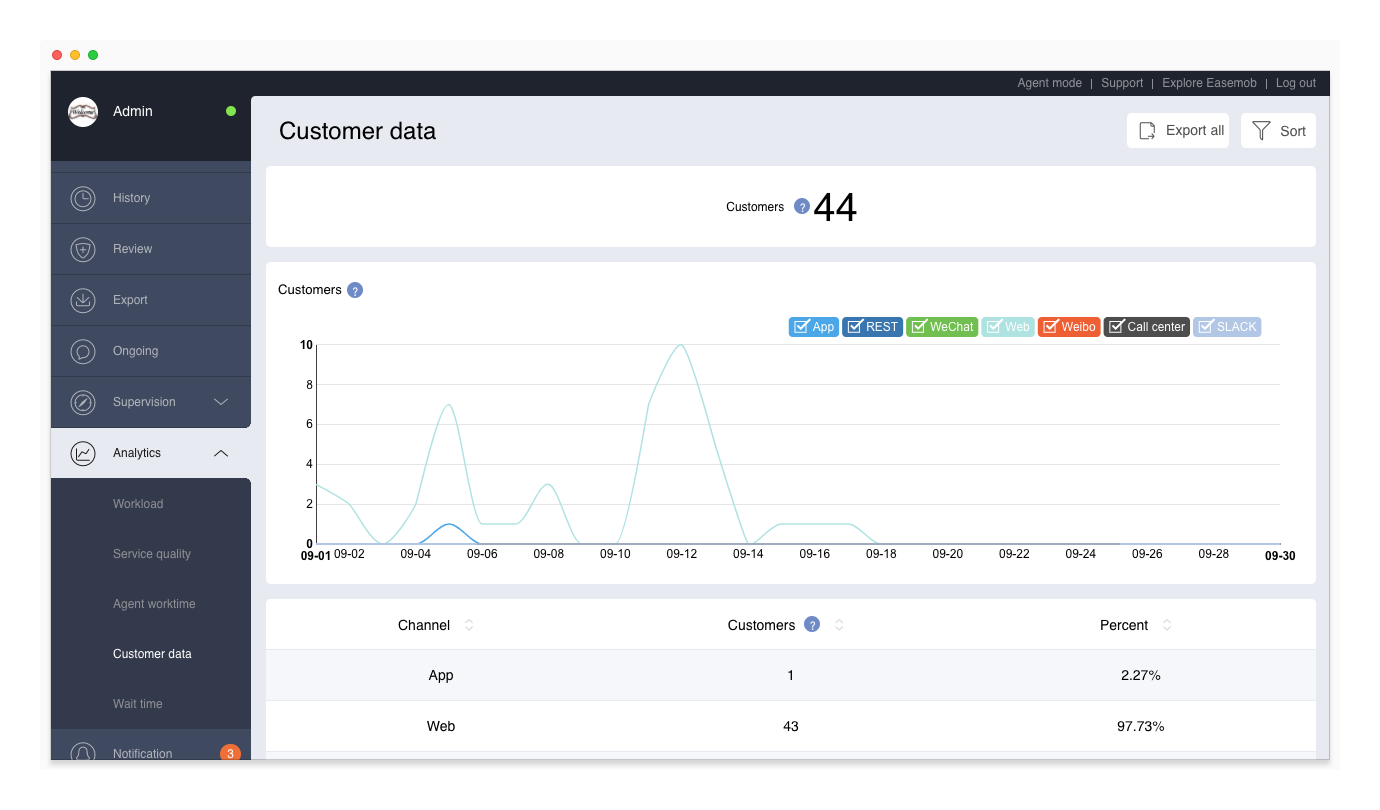
The customer data report contains the number of individual customers, the trend of individual customers, the number of individual customers in different channels, and the percentage. The customer data can be filtered based on the time period, channel, channel account, customer tags, and number of visits. All query results are displayed in real time.
To view the customer data report, go to “Admin Mode > Analytics > Customer Data”. By default, the Customer Data page displays the number of new customers from all channels this week.
Customers
Display the number of individual customers. The number of individual customers is updated in real time.
Trend of Customers
Display the trend of daily individual customers from different channels. If the channel account, customer tag, or number of visits is selected, the total number of individual customers is displayed. The following figure shows an example of the trend of individual customers from different channels.
Customer Data
The number of individual customers is displayed based on the channel, channel account, customer tag, and the number of visits.
Note: Data related to customer tags are not real-time, and they are updated around 0:00 every day. For example, if a customer tag is added to a customer during an ongoing conversation on day 1, the number of customers with the tag is updated on day 2, whether or not the conversation is closed.
Filter Customer Data
To filter customer data, click Sort on the Customer Data page, and select the time period and the display items (by channel, by channel account, by customer tag, by visiting times).
Export the Customer Data Report
On the Customer Data page, click Export All to export a customer data report in a CSV file. The CSV file can be used for data accumulation and analysis.
Wait Time
The wait time report includes the overview, 24-hour conversations, 24-hour queuing trend, daily queuing trend, and wait times distribution. You can quickly find out the time period when there are a large number of conversations and messages and long wait time and make appropriate arrangements for your team. You can query and export reports based on the following filtering options: time period (conversation creation time), conversation tag, channel, channel account, wait time exceeds x seconds, and customer tag. All query results are displayed in real time.
To view the wait time report, go to “Admin Mode > Analytics > Wait Time”. By default, the Wait Time page displays the queuing data for all conversations that are created this week and have a wait time of more than 60 seconds.
Note: To view queuing conversations, go to “Agent Mode > Queue”.
Overview
The wait time overview includes the total number of wait times and the average wait time for the filtered conversations. The wait time of a conversation is the time that the conversation spends in the Queue.
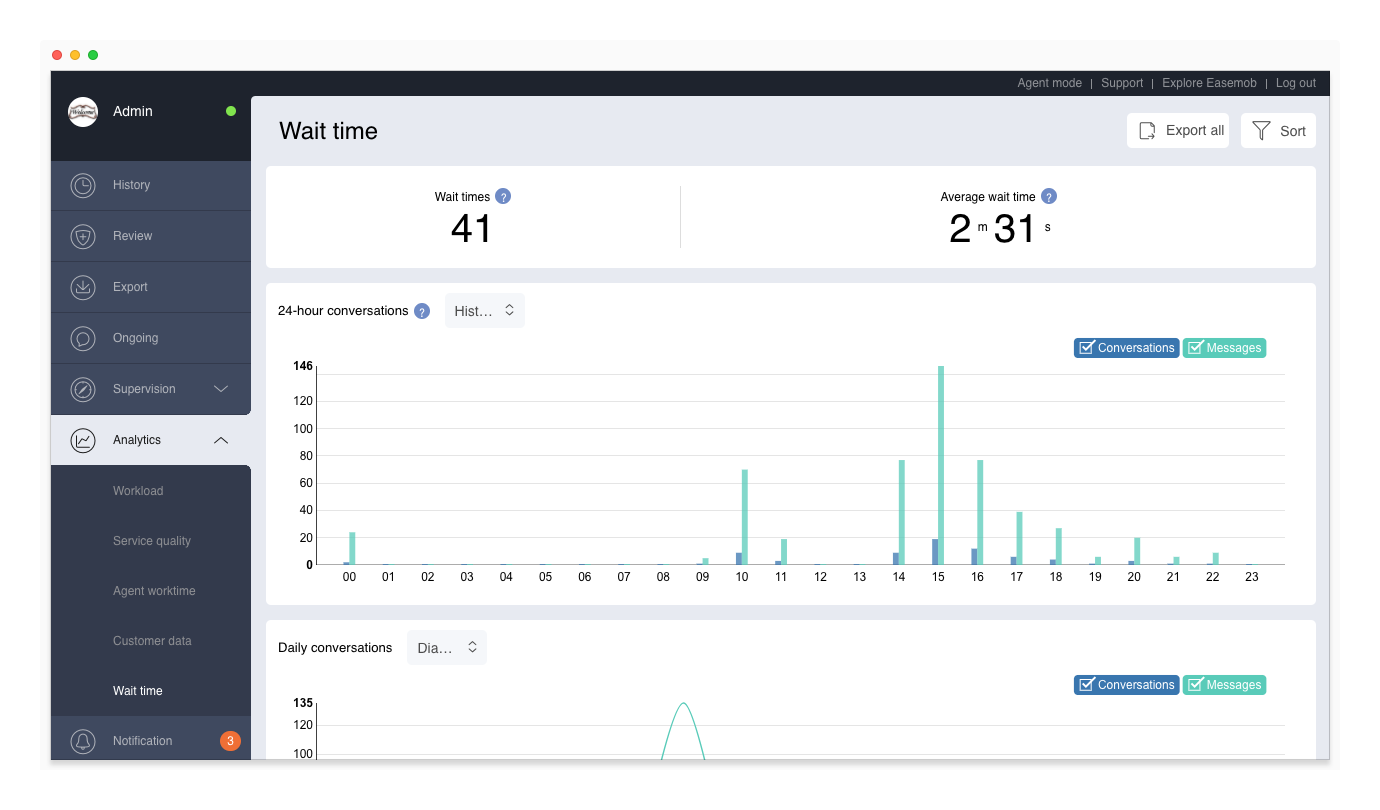
Note: In the above figure, the wait time is measured by hours/minutes/seconds. The maximum value is 99999 hours 59 minutes 59 seconds. The actual value is displayed in other parts of the wait time report.
The wait time metrics are described as follows:
- Wait times: Number of times that the conversation spends more than x seconds in the Queue. The default is the number of times that the conversation spends more than 60 seconds in the Queue. If a conversation is queued for more than x seconds for multiple times, all the wait times are calculated.
- Average wait time: Average of the wait time of all conversations. Average wait time = (1st wait time + 2nd wait time + … + Nth queuing time)/N.
24-Hour Conversations
Display the number of new conversations created within each hour (eg: 0:00:00-0:59:59) and the number of messages in these conversations in a diagram or histogram. Queuing conversations and their messages are included.
Daily Conversations
Display the number of new conversations created each day (eg: 0:00:00-23:59:59) and the number of messages in these conversations in a diagram or histogram. Queuing conversations and their messages are included.
24-Hour Queuing
Display the queuing status of the conversations in every hour (eg: 0:00:00-00:59:59). The queuing status includes the wait times, average wait times, average wait time and maximum wait time.
- Wait times: Total number of wait times of the conversations every hour.
- Average wait times: Average of the wait times of the conversations every hour.
- Average wait time: Average of the wait time of the conversations every hour.
- Maximum wait time: Maximum wait time among all the conversations every hour.
= Daily Queuing ===
Display the queuing status of the conversations in every day (0:00:00-23:59:59). The queuing status includes the wait times, average wait times, average wait time and maximum wait time.
- Wait times: Total number of wait times of the conversations every day.
- Average wait time: Average of the wait time of the conversations every day.
- Maximum wait time: Maximum wait time among all the conversations every day.
Wait Times Distribution (by Conversation Tags)
Display the wait times distribution based on the conversation tags. You can find out the type of conversations that enter the Queue most frequently.
Filter Wait Time Data
To filter wait time data, click Sort on the Wait Time page, and select the time period, conversation tag, channel, channel account, wait time exceeds x seconds, and customer tag.
Export the Wait Time Report
On the Wait Time page, click Export All to export a wait time report in a CSV file. The CSV file can be used for data accumulation and analysis.